"quantity"exercise:Price target
学习是一个不断积累的过程,每天学习一点,每天进步一点!为了帮助大家更高效地备考2021年CFA考试,正保会计网校每日为大家上新CFA习题供大家练习。让网校与您一起高效备考2021年CFA考试,梦想成真!
Questions 1:
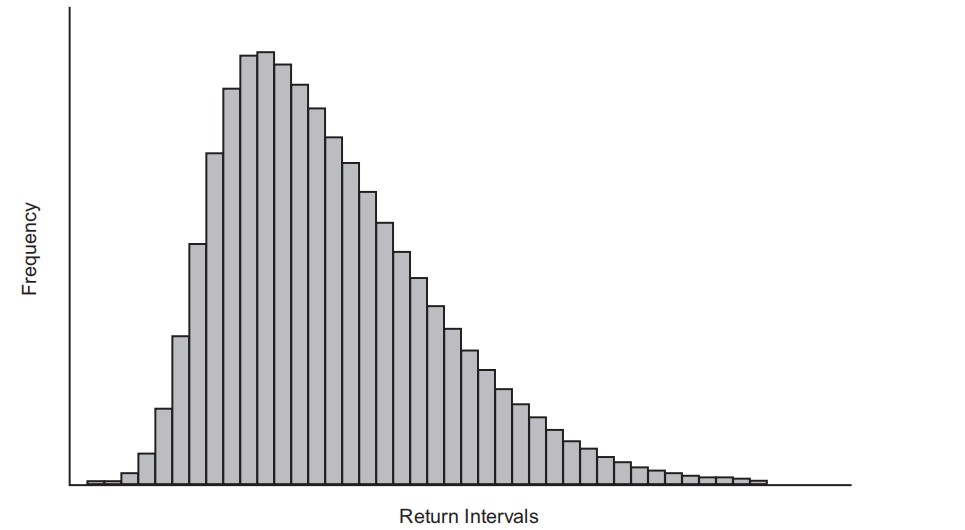
The figure below shows the histogram for the distribution of weekly returns on an index.

The median of the returns on the index, if compared to the mean, will most likely be:
A 、smaller.
B、 equal.
C、 greater.
Questions 2:
A technical analyst observes a head and shoulders pattern in a stock she has been following. She notes the following information:

Based on this information, her estimate of the price target is closest to:
A、 $59.50.
B 、$48.00.
C 、$44.50.
A is correct. The histogram clearly shows that the return distribution of the index is positively skewed (skewed to the right) and is unimodal (it has one most frequently occurring value). For a positively skewed unimodal distribution, the median is always less than the mean.
B is incorrect. By looking at the histogram, it is clear that the return distribution of the index is positively skewed (skewed to the right) and is unimodal (it has one most frequently occurring value). For a positively skewed unimodal distribution, the median is always less than the mean.
C is incorrect. By looking at the histogram, it is clear that the return distribution of the index is positively skewed (skewed to the right) and is unimodal (it has one most frequently occurring value). For a positively skewed unimodal distribution, the median is always less than the mean.
B is correct. Price target = Neckline − (Head − Neckline). In this example, Price target = $65.75 − ($83.50 − $65.75) = $65.75 – $17.75 = $48.00.
A is incorrect because 59.50 = Neckline – (Shoulder – Neckline) = 65.75 – (72 – 65.75).
C is incorrect because 44.50 = Current Price – (Head – Current Price) = 64 – (83.50 – 64).
成功=时间+方法,自制力是这个等式的保障。世上无天才,高手都是来自刻苦的练习。而人们经常只看到“牛人”闪耀的成绩,其成绩背后无比寂寞的勤奋。小编相信,每天都在勤奋练习,即使是一点点的进步,大家一定可以成为人人称赞的“牛人”。


